Survey Progress and Bottom Temperatures
The goal of the eastern and northern Bering Sea bottom trawl surveys is to collect data on the ranges and populations of fish, crab, and other bottom-dwelling species in the Bering Sea. Temperature heavily influences these ranges and populations, so ocean bottom temperatures are recorded from all the areas the survey collects catch samples. Here we share these temperatures in near real-time. NOAA Fisheries has annually conducted the eastern Bering Sea survey since 1982, except in 2020, making this the longest running, standardized time series of fish and invertebrate data in the region (42 years!). The northern Bering Sea survey has been conducted six times since 2010 (2010, 2012, 2016, 2021, 2022, 2023) and is dependent on available funding.
Learn more about this survey and view temperature maps from previous years. All data collected on these surveys are and will be publicly accessible from:
- Fisheries One Stop Shop public data portal
- Distribution Mapping and Analysis Portal
- Alaska Fisheries Information Network
View static maps of each day's progress and bottom temperatures (degrees Celsius; °C) will be available when the survey begins. The last page includes a map of the full Bering Sea survey footprint with bathymetry at 50, 100, and 200 meters.

Survey Dates
The eastern Bering Sea bottom trawl survey is scheduled to run from June 1 to August 1. The northern Bering Sea bottom trawl survey will take place afterwards, until August 22. Both surveys will be conducted on the F/V Northwest Explorer and the F/V Alaska Knight. Tentatively, the vessels will return and dock in Dutch Harbor between legs 1 and 2 on June 21, and between legs 2 and 3 and July 11. Currently, leg 4 marks the start of the northern Bering Sea bottom trawl survey, departing from Nome on August 1 between legs 3 and 4. At the end of the fourth and final leg both vessels will return to Dutch Harbor on August 22. There, both vessels demobilize and the survey scientists return to their computers to finalize and report the data collected. We will keep the communities informed of our survey progress by posting regular updates via the website and social media (Facebook and Instagram). Look out for preliminary results from the survey in our fall University of Alaska Fairbanks Strait Science Seminar, radio and newspaper interviews, and the September Joint Groundfish Plan Team presentation.

Survey Location
The eastern Bering Sea bottom trawl survey begins in Dutch Harbor, Alaska, where the vessels transition to eastern Bristol Bay to begin sampling. From Bristol Bay, the survey proceeds westward completing north-south columns of the survey on their way to the shelf edge. The east-to-west survey progression is based on an understanding of historical trends in fish movement. It is intended to ensure the survey moves in the opposite direction of the seasonal on-shelf (eastward) migration patterns typical of yellowfin sole and other species. After the completion of the eastern Bering Sea shelf survey, both vessels begin sampling survey stations in the northern Bering Sea survey region.

Bering Sea Cold Pool
Each spring, the previous winter’s melted sea ice forms a cold pool in the Bering Sea. The location and temperature of this cold pool changes from year to year and affects fish, crab, and other bottom-dwelling species movement and ranges. Due to warming ocean temperatures in the Bering Sea, scientists track and closely monitor the location of the cold pool by collecting ocean bottom temperatures at each station. The area that the cold pool covers is represented by the cold pool extent index, which is defined as the total area of the eastern Bering Sea survey area where bottom temperatures are less than or equal to 2°C, in units of square kilometers. Mean bottom temperatures can help us compare temperatures this year to temperatures of the past, and understand how those temperatures have changed over time. Learn more about temperature anomalies, the cold pool, and how these temperatures have changed over time.

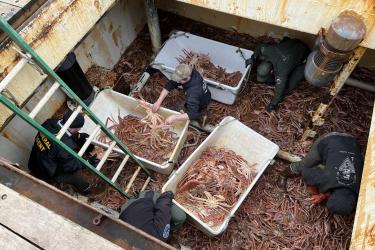
Pictures from the field
What does survey life and research look like? Explore our photo gallery (coming soon) to see this current survey’s photos from scientists in the field. These photos show the incredible places that NOAA scientists go and showcase our mission in ways that words cannot.